Review time folks!!!- 17th March 2015 carried the following blogpost:
entitled “Fighting Deflation in India Amidst Capital flow Vulnerabilities and Imminent US Fed Rate Hike“
So hows it been over the last 5 months or so? Lets review it now -
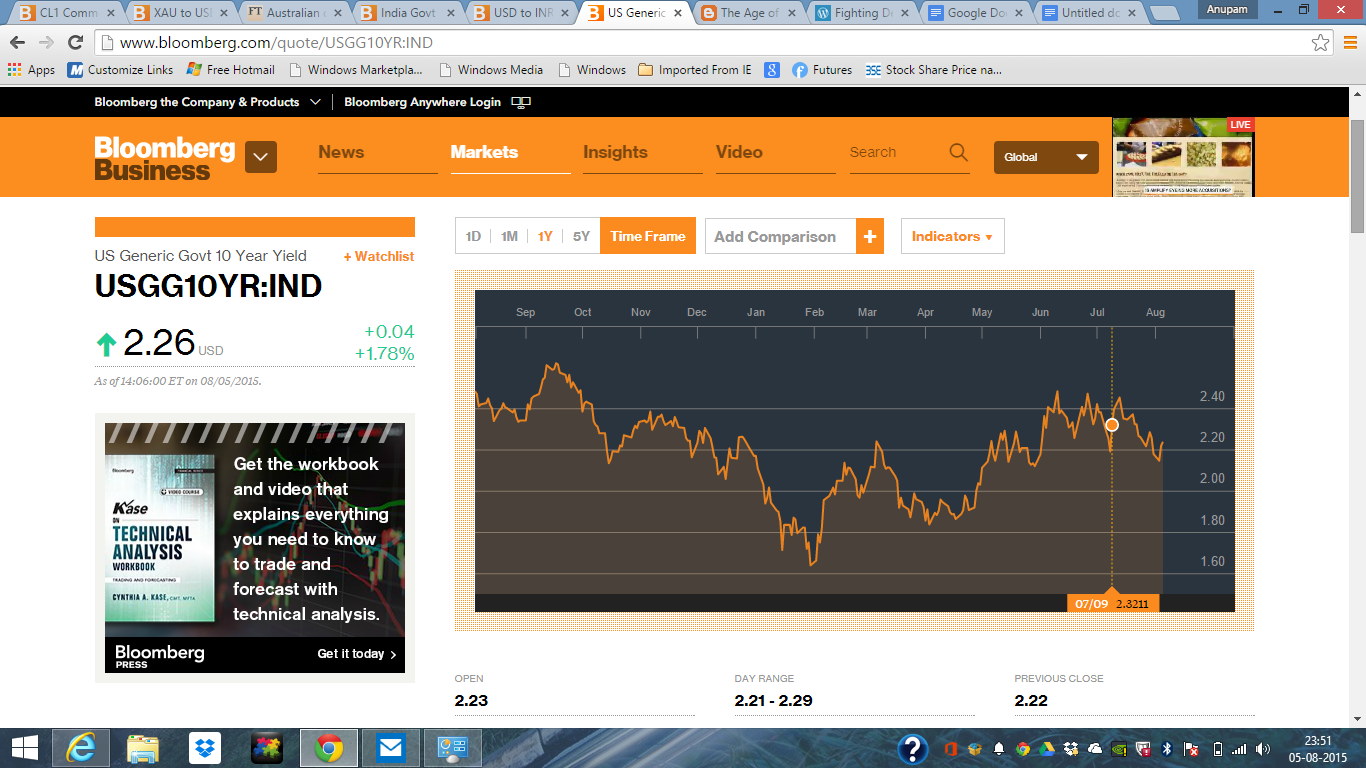
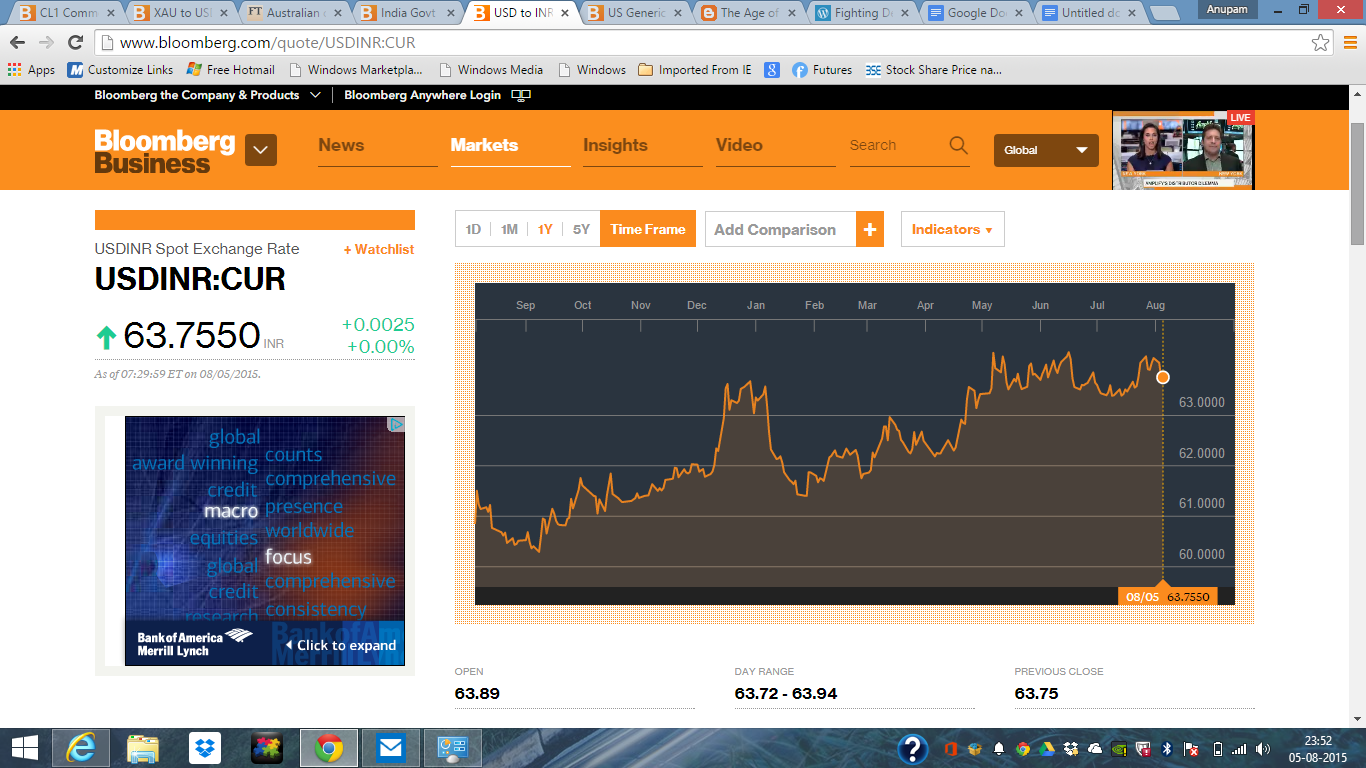
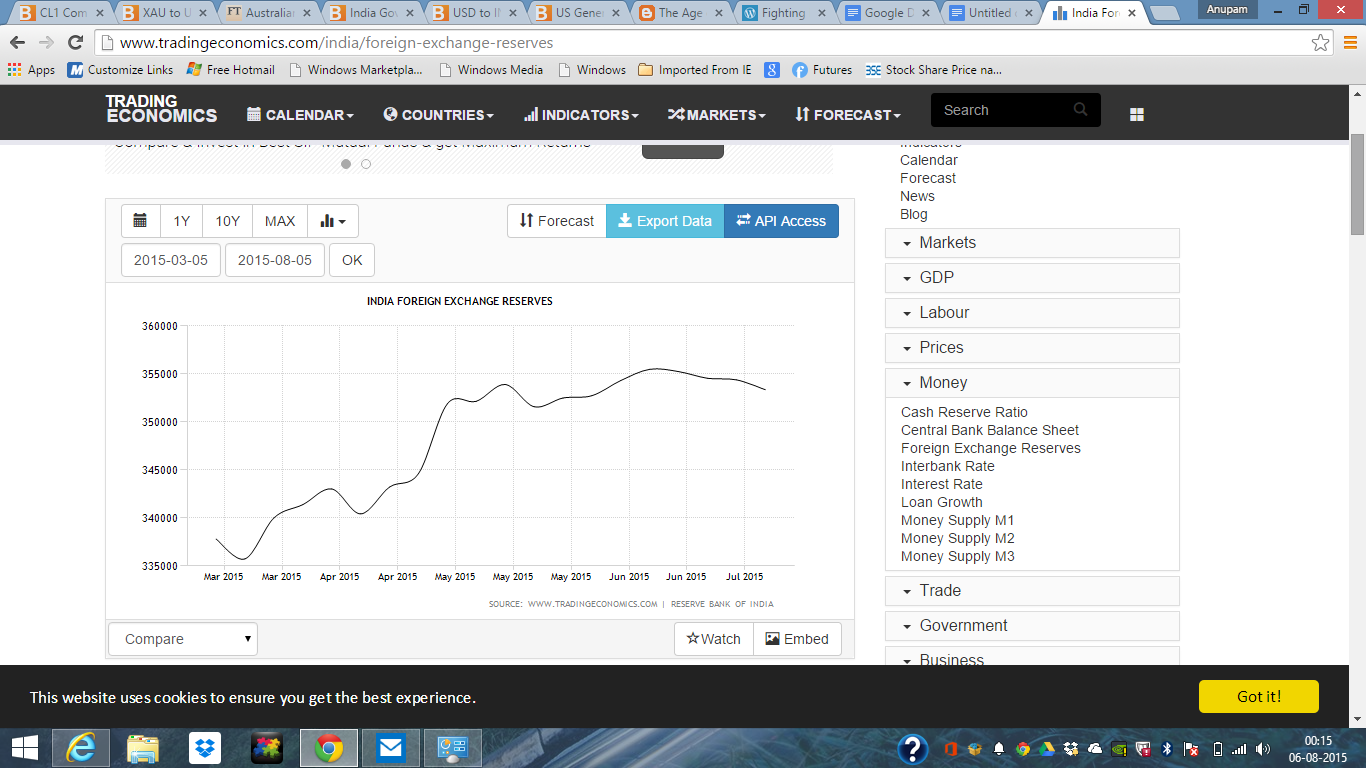
RBI cut repo rate once in June ‘15 by 25 bps. Indian 10 yr sovereign is almost unchanged at 7.8%. The US Fed has not moved and we think it will move in September or December for the first token increase in almost three quarter of a decade. US 10 year yields have moved up by about 20 bps to 2.25%. India’s FX reserves has increased by USD 20 Billion thanks to RBI’s strenuous efforts in this direction, even though Gold prices and bond holding MTMs have fallen- which goes to say that had these asset prices remained same over the 5 month period, the increase in reserves would have been optically higher. Our original model says under such conditions the currency should move almost as per the forward rate curve, and it has. There has not been much volatility in the currency pair since March, again in agreement with the model.
So what is next? The question uppermost on the minds of everyone is whether a US Fed Monetary Policy tightening will induce the same kind of volatility that we witnessed in July 2013? The US Fed is now getting very certain that their target Federal Funds rate should be at least 125-150 bps higher until December 2016 next year given the strength of the US economy, if not more. The issue at hand is critical- what if US$ carry trade unwind and JPY carry trade unwind were to coincide with a Chinese stock market crash(See https://ageofdeflation.wordpress.com/2015/07/10/avoiding-chinese-collapse-and-a-simultaneous-jpy-carry-trade-unwind/) when the US Fed has hiked rates by 125-150 bps by 2016 end? Then it will be a global market crash- India included- and Indian asset markets will take a drubbing in such a worst case scenario(this scenario has a 3% probability).
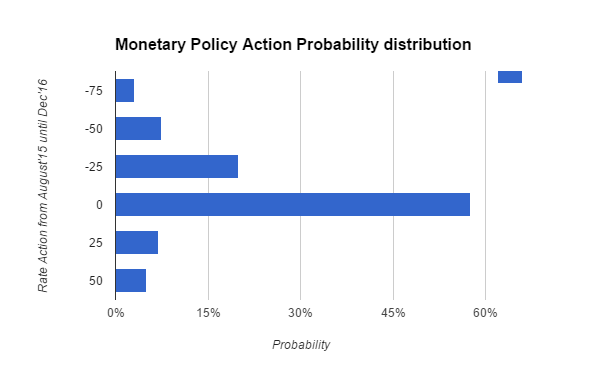
Probabilities scientifically to all the possible 8 scenarios:
State of Macroeconomy
|
Probability of Macro economy to exist at the given state; incorporating all publicly known information
|
Expected Policy Response from Aug '15 until Dec'16
|
eco doing gr8; inflation at 5%
|
20.00%
|
25 bps rate cut
|
eco doing gr8; inflation at 6%
|
37.50%
|
no rate cut
|
eco doing gr8 inflation at 5.5%
|
10.00%
|
no rate cut
|
eco not doing well but inflation at 6%
|
10.00%
|
no rate cut
|
eco doing badly, inflation at 4%
|
7.50%
|
50 bps rate cut
|
eco doing great ; inflation at 7%
|
7.00%
|
25 bps rate hike
|
eco doing great inflation hitting 7.5%
|
5.00%
|
50bps rate hike
|
eco doing very badly inflation at 3%
|
3.00%
|
75bps rate cut
|
The Average expected Policy response is -6 bps, with Standard deviation of 24.5 bps. So (Mean - Sigma is -30.5 bps) and (Mean + Sigma is +18.5 bps).
So what about the Indian 10 year yield and the USD/INR? Based on the probability distribution of various scenarios as above, and based on the likeliest concurrent US Fed /US Economic scenarios as detailed below, the currency and the 10 yr yield in India would stand at three different combinations (a),(b),(c) as detailed in the last column below:
State of Macroeconomy
|
Probability of State 0f Macro economy to exist
|
Expected Policy Response from Aug '15 untill Dec'16
|
State of Macroeconomy
|
us fED fUND RATE
|
US 10 Yr
|
India FX Reserves
|
INR
|
India 10 YR
|
eco doing gr8; inflation at 5%
|
20.00%
|
25 bps rt cut
|
eco doing gr8; inflation at 5%
|
1.5
|
4.25
|
Unchanged
|
(a) 68.8 (b) 69.1 (c) 69.45
|
(a) 8.15% (b) 7.8% (c) 7.4%
|
eco doing gr8; inflation at 6%
|
37.50%
|
no rate cut
|
eco doing gr8; inflation at 6%
|
1.5
|
3.75
|
Unchanged
|
(a) 68.8 (b)69.15
(c) 69.35
|
(a) 7.9% (b) 7.5% (c) 7.25%
|
eco doing gr8 inflation at 5.5%
|
10.00%
|
no rate cut
|
eco doing gr8 inflation at 5.5%
|
1.5
|
4
|
Unchanged
|
(a) 68.8 (b) 69.1 (c) 69.45
|
(a) 8.15% (b) 7.8% (c) 7.4%
|
eco not doing well but inflation at 6%
|
10.00%
|
no rate cut
|
eco not doing well but inflation at 6%
|
1.5
|
3.25
|
Unchanged
|
(a) 68.8 (b) 69.15 (c) 69.25
|
(a) 7.4% (b) 7.1% (c) 6.9%
|
eco doing badly, inflation at 4%
|
7.50%
|
50 bps rate cut
|
eco doing badly, inflation at 4%
|
0.75
|
2.5
|
320 Billion US$
|
(a) 68.8 (b) 69.15 (c) 69.35
|
(a) 7.5% (b) 7.1% (c) 6.9%
|
eco doing great ; inflation at 7%
|
7.00%
|
25 bps rate hike
|
eco doing great ; inflation at 7%
|
1.5
|
3.25
|
Unchanged
|
(a) 68.8 (b) 69.15 (c) 69.35
|
(a) 7.65% (b)7.25%
(c) 7%
|
eco doing great inflation hitting 7.5%
|
5.00%
|
50bps rate hike
|
eco doing great inflation hitting 7.5%
|
1.5
|
3
|
Unchanged
|
(a) 68.8 (b) 69.15 (c) 69.35
|
(a) 7.65% (b) 7.25% (c) 7%
|
eco doing very badly inflation at 3%
|
3.00%
|
75bps rate cut
|
eco doing very badly inflation at 3%
|
1.5
|
3.75
|
300 billion US$
|
(a) 68.8 (b) 69.1 (c) 69.3
|
(a) 8.35% (b) 8.0% (c) 7.8%
|
Having run the numbers, the takeaway is mainly that there is very less chance(3%) of markets getting spooked in India against a general reversal of carry trade in the US and in Japan. So less reason to worry overall. Indian sovereign yield hunters need to sharply look out for signals from the FX markets including USD/INR and India’s FX reserves and not to forget the steepness of the US Yield curve. Having said that, 3% probability is 1 in 33 and not so uncommon after all. Some concerted tomfoolery is all that is required to hit that!! Hope folks across vales and ponds are a bit mindful of that when they go about their daily chores.
Charts for reference - US 10 yr; USD/INR FX; Indian FX reserves
No comments:
Post a Comment